Seasonal Form Fluctuations: Tracking Cyclical Performance Swings Across Soccer Leagues, Court Schedules, and Track Circuits
Jonas Keller · Aug 21, 2026
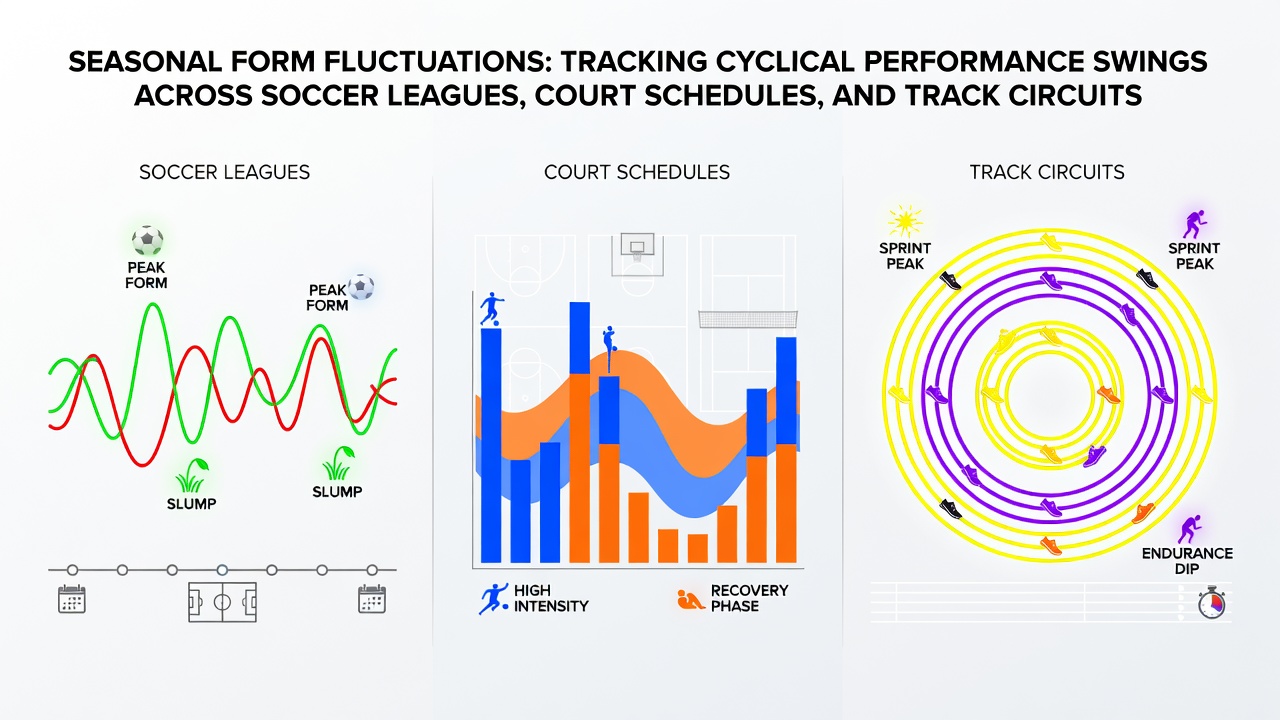
Seasonal Form Fluctuations: Tracking Cyclical Performance Swings Across Soccer Leagues, Court Schedules, and Track Circuits
Seasonal form fluctuations appear consistently across multiple sports as performance patterns shift with fixture density, weather changes, and recovery periods. Researchers track these swings through historical data sets that span soccer leagues in Europe and South America, court schedules in tennis and basketball, and track circuits in thoroughbred racing. Data from major competitions shows that teams and individuals often peak or dip at predictable intervals tied to calendar months rather than random variance.
Patterns in Soccer Leagues
Soccer competitions reveal clear cyclical trends when analysts examine goal tallies, win rates, and injury reports across full seasons. European domestic leagues typically begin pre-season preparations in July and open fixtures in August, which creates an early surge in output for squads that maintain fitness through the summer break. Observers note that mid-season dips emerge around December and January when congested schedules collide with colder temperatures and travel demands. Studies compiled by the Australian Institute of Sport indicate that recovery windows shorten during these months and correlate with measurable drops in high-intensity running metrics.
League tables from the 2025-2026 campaigns illustrate how clubs that rotate squads effectively during the autumn months sustain higher points-per-game averages into the spring. In contrast, sides that rely on the same starting eleven experience steeper declines once fixture congestion intensifies. South American leagues follow an opposite calendar with summer breaks falling during European winters, and data shows comparable swings when adjusted for local climate variables.
Court Schedules in Tennis and Basketball
Tennis tours and basketball seasons produce their own cyclical signatures. Grand Slam events cluster in specific quarters while the NBA stretches from October through June with back-to-back games and road trips that accumulate fatigue. Performance databases reveal that serve percentages and three-point accuracy often rise after scheduled rest periods and fall during extended travel stretches. Figures released by the NCAA research division highlight that conference play in January and February produces higher scoring margins than the preceding non-conference slate because teams refine rotations over multiple weeks.
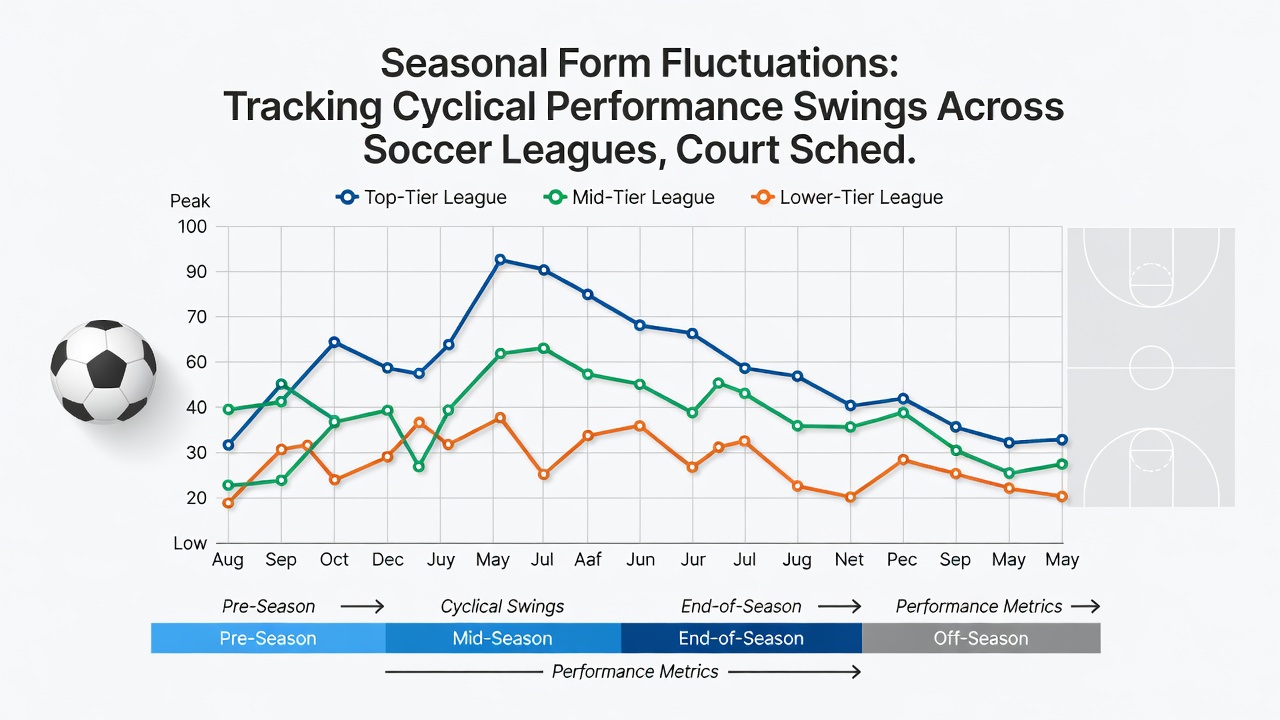
August 2026 marks the start of the US Open and the lead-in to European club basketball campaigns. Historical records show that players who compete deep into the summer hard-court swing frequently carry residual fatigue into the fall indoor season. Those who schedule deliberate breaks demonstrate improved win percentages once the new circuit begins. Basketball analysts track similar trends by monitoring minutes-per-game loads and how they affect fourth-quarter efficiency ratings later in the year.
Track Circuits and Thoroughbred Racing
Horse racing circuits display seasonal form cycles shaped by ground conditions, race distances, and training regimens. Northern Hemisphere tracks transition from turf to all-weather surfaces as autumn arrives, while Australian and South African meets peak during their summer months. Performance records maintained by the Hong Kong Jockey Club demonstrate that horses returning from lay-offs in late summer post stronger speed figures when trainers align preparation with firmer ground. Conversely, early spring meetings often produce slower overall times until surfaces stabilize after winter rains.
Trainers monitor workout patterns and barrier trials to forecast which runners will handle the shift from one surface type to another. Data collected across multiple jurisdictions shows that juveniles debuting in August and September frequently outperform market expectations when their pedigrees suit the prevailing conditions. Mature horses that peak during the spring classics sometimes flatten in subsequent autumn starts unless campaigns are spaced to allow full recovery between major targets.
Methods for Tracking Fluctuations
Analysts combine multiple data streams to identify these cyclical movements. Performance metrics, travel logs, injury registers, and surface reports feed into models that flag periods of elevated or reduced output. University studies from Canada and New Zealand confirm that combining longitudinal statistics with short-term indicators improves accuracy when predicting the timing of form swings. Observers who integrate these inputs across soccer, court sports, and racing circuits produce more consistent projections than those who examine each sport in isolation.
August 2026 offers a fresh window for observers to test these tracking methods as new seasons commence simultaneously across hemispheres. Early results from pre-season tournaments and trial meetings provide baseline figures that later rounds can be measured against. Those who maintain updated databases notice when squads or competitors deviate from established seasonal norms and adjust projections accordingly.
Conclusion
Seasonal form fluctuations operate as measurable, recurring features across soccer leagues, tennis and basketball schedules, and horse racing circuits. Comprehensive tracking relies on historical patterns, current condition indicators, and cross-sport comparisons that reveal how calendar timing influences results. Data sets compiled over multiple years continue to supply the foundation for understanding these cycles and anticipating when performance levels are likely to rise or fall.