Mapping Referee Tendency Databases to Live Line Shifts in Midweek European Soccer Leagues
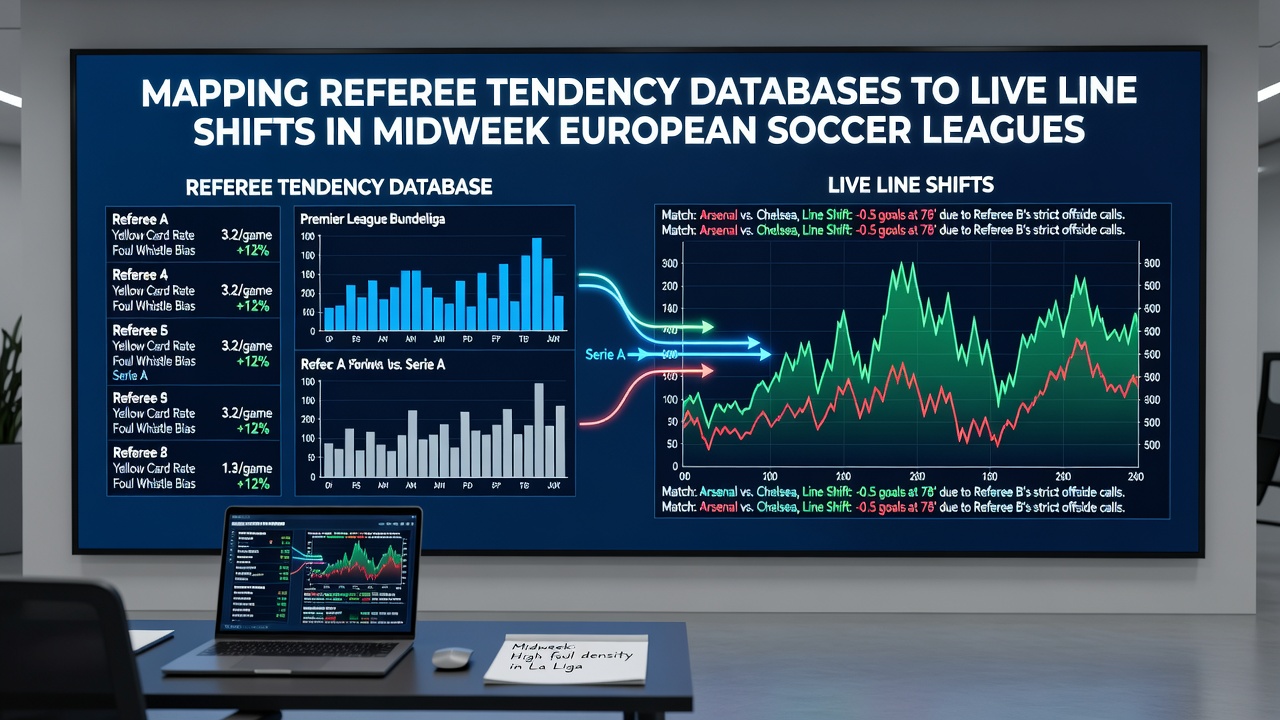
European soccer leagues generate extensive referee data sets that track fouls, cards, penalties, and stoppage patterns across thousands of matches each season. Analysts compile these records into specialized databases that highlight individual officials' tendencies, such as higher card rates in certain competitions or leniency toward home sides during high-stakes fixtures. Midweek matches in leagues like the Bundesliga, Serie A, and La Liga often feature congested schedules that amplify these patterns because teams rotate squads and fatigue influences decision-making on the pitch.
Live betting lines adjust rapidly when in-game events align with documented referee behaviors. Bookmakers incorporate real-time feeds from optical tracking systems and official match reports to recalibrate odds on cards, corners, and total goals. Mapping exercises connect historical referee profiles to these movements by identifying correlations between an official's average cards per game and sudden shifts in live over/under markets. Researchers at institutions across the EU have examined how such mappings improve predictive models for accumulator bets during Tuesday and Wednesday rounds.
Core Components of Referee Tendency Databases
Databases aggregate statistics from governing bodies and performance analysts who record every decision in standardized formats. Metrics include yellow cards issued per 90 minutes, penalty awards relative to expected foul locations, and time added at halftime and full time. Midweek European fixtures introduce variables such as travel recovery and fixture congestion that alter player aggression levels, which in turn interact with referee styles documented over multiple seasons. Observers note that certain officials maintain consistent thresholds regardless of schedule density while others show measurable deviations during congested periods.
Integration with optical data from providers like Opta and StatsBomb allows precise geospatial mapping of fouls and cards. This layer reveals whether an official favors strict enforcement near the penalty area or permits more physical play in midfield zones. July 2026 updates to these systems incorporated additional tracking from UEFA Nations League qualifiers, supplying fresh samples for model refinement ahead of the new domestic campaigns.
Mechanics of Live Line Adjustments
Live odds platforms receive continuous inputs from match data feeds and adjust probabilities within seconds of events. When a referee issues an early yellow card, algorithms recalculate expected card totals and push lines accordingly. Midweek schedules intensify this dynamic because reduced recovery time correlates with elevated foul rates across multiple leagues. Data from the 2025-2026 campaign showed average card counts rising by 0.4 per match in midweek rounds compared with weekend fixtures in the same divisions.
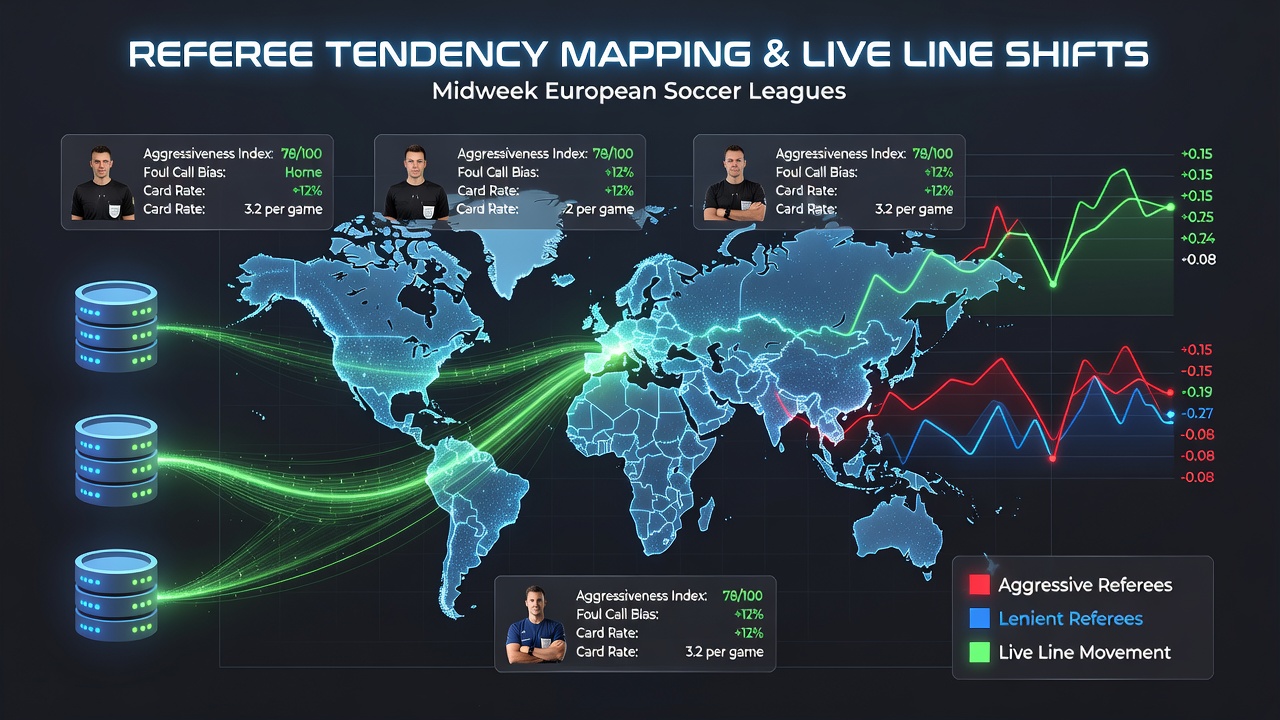
Mapping techniques overlay referee profiles onto these live movements by calculating deviation scores. A referee with a documented 5.2 cards per game average might trigger larger line shifts after the second booking than one averaging 3.8. Traders monitor these discrepancies to identify inefficiencies where market reactions lag behind historical benchmarks. European betting operators have adopted similar frameworks to calibrate risk parameters during high-volume midweek betting windows.
Application in Midweek European Contexts
Midweek European soccer often involves cup ties and European competition carryovers that place referees under greater scrutiny. Databases flag officials who award more penalties in away fixtures or extend stoppage time disproportionately when scores remain level. Analysts cross-reference these flags against live line data to isolate situations where betting markets overreact or underreact to early cards. Studies conducted at Australian sports research centers have quantified how such mappings reduce variance in projected outcomes for totals markets.
Fixture congestion during March and April spills into preparatory data sets used for summer planning, yet July 2026 brought targeted refreshes focused on new referee promotions across Serie A and the Bundesliga. These updates refined penalty frequency models and improved alignment between pre-match expectations and in-game line volatility. Teams in midweek slots frequently field altered lineups, which changes foul locations and interacts directly with referee spatial tendencies recorded in the databases.
Analytical Techniques and Data Integration
Statistical mapping employs regression models that treat referee identity as a fixed effect while controlling for team strength, venue, and time of week. Live line shifts serve as the dependent variable, measured in basis points across card and goal markets. Validation against historical midweek samples from 2023 through 2025 demonstrates improved accuracy when referee-specific coefficients are included. Industry reports from Canadian gaming associations highlight similar gains in operational efficiency for operators managing real-time risk across multiple European time zones.
Visualization tools display heat maps of referee decisions alongside corresponding odds trajectories, enabling rapid identification of actionable patterns. Midweek data subsets reveal stronger correlations during evening kickoffs when player fatigue compounds physical challenges. External validation from academic sources, including papers published through EU-funded sports analytics initiatives, confirms that these integrated approaches outperform baseline models that ignore referee profiles.
Conclusion
Mapping referee tendency databases to live line shifts supplies a structured method for interpreting volatility in midweek European soccer markets. The approach draws on comprehensive records of cards, penalties, and stoppages while accounting for schedule-specific factors that distinguish Tuesday and Wednesday fixtures. Continued refinement of these models, supported by updated datasets in July 2026, sustains alignment between documented referee behaviors and observable movements in betting lines across major continental leagues.